
Sustainability
Carbon footprint
Plastic
Waste reduction
Plastic credits
CSRD
For most companies, the largest figure in the carbon inventory is not the office, the vehicle fleet, or the electricity bill. It sits upstream, in the goods and materials a business buys to make and sell its products. These purchased inputs form the bulk of a company’s Scope 3 emissions, which routinely exceeds everything the business controls directly, and can add up to 90% of their global footprint.
Each of those emissions begins in a physical place. Every material a company buys can be traced to a field, a forest, or a stretch of coastline, and following that trail turns an abstract reporting figure into data tied to a specific landscape. This is the reason why Scope 3 emissions are so hard to measure, and the reason land-use data is the element most corporate footprints omit.
This article traces two everyday examples, the fibre in a garment and the plastic around a product, from the land they come from to the point where they appear in a company's Scope 3 emissions. Comparing cotton with linen shows how a single choice of material changes the land and water behind a product, and plastic packaging shows the same pattern, from production to disposal.
Both lead to the same conclusion: The emissions that matter most begin in a physical place that spend-based accounting tends to average away, which makes accurate land-use data the missing piece in a thorough environmental footprint assessment. The practical starting point for any business is therefore to measure its carbon footprint in enough detail to see where those emissions originate.
Why Scope 3 emissions dominate the corporate footprint
The GHG Protocol, the accounting standard behind most corporate carbon reporting, sorts emissions into three scopes according to how directly a company controls them.
-
Scope 1 — direct emissions. Scope 1 covers emissions from sources a company owns or controls. This includes fuel burned on site in boilers, furnaces, and generators; fuel used in company-owned vehicles; process emissions released during manufacturing; and fugitive emissions such as refrigerant or gas leaks. These are the emissions a business produces at its own facilities and from its own equipment.
-
Scope 2 — purchased energy. Scope 2 covers the indirect emissions of the energy a company buys and consumes: electricity, heating, and cooling. The company does not release these emissions on site; they occur at the power station or utility that generates the energy. Scope 2 is calculated two ways — a location-based method using the average emissions of the local grid, and a market-based method reflecting the specific supply contracts a company holds, such as renewable energy agreements.
-
Scope 3 — value chain emissions. Scope 3 covers everything else: the indirect emissions across a company's value chain that it influences but does not own. The GHG Protocol divides these into 15 categories, grouped into upstream activities (what a company buys) and downstream activities (what happens to its products after sale).
Read more: How to improve Scope 3 data accuracy for CSRD
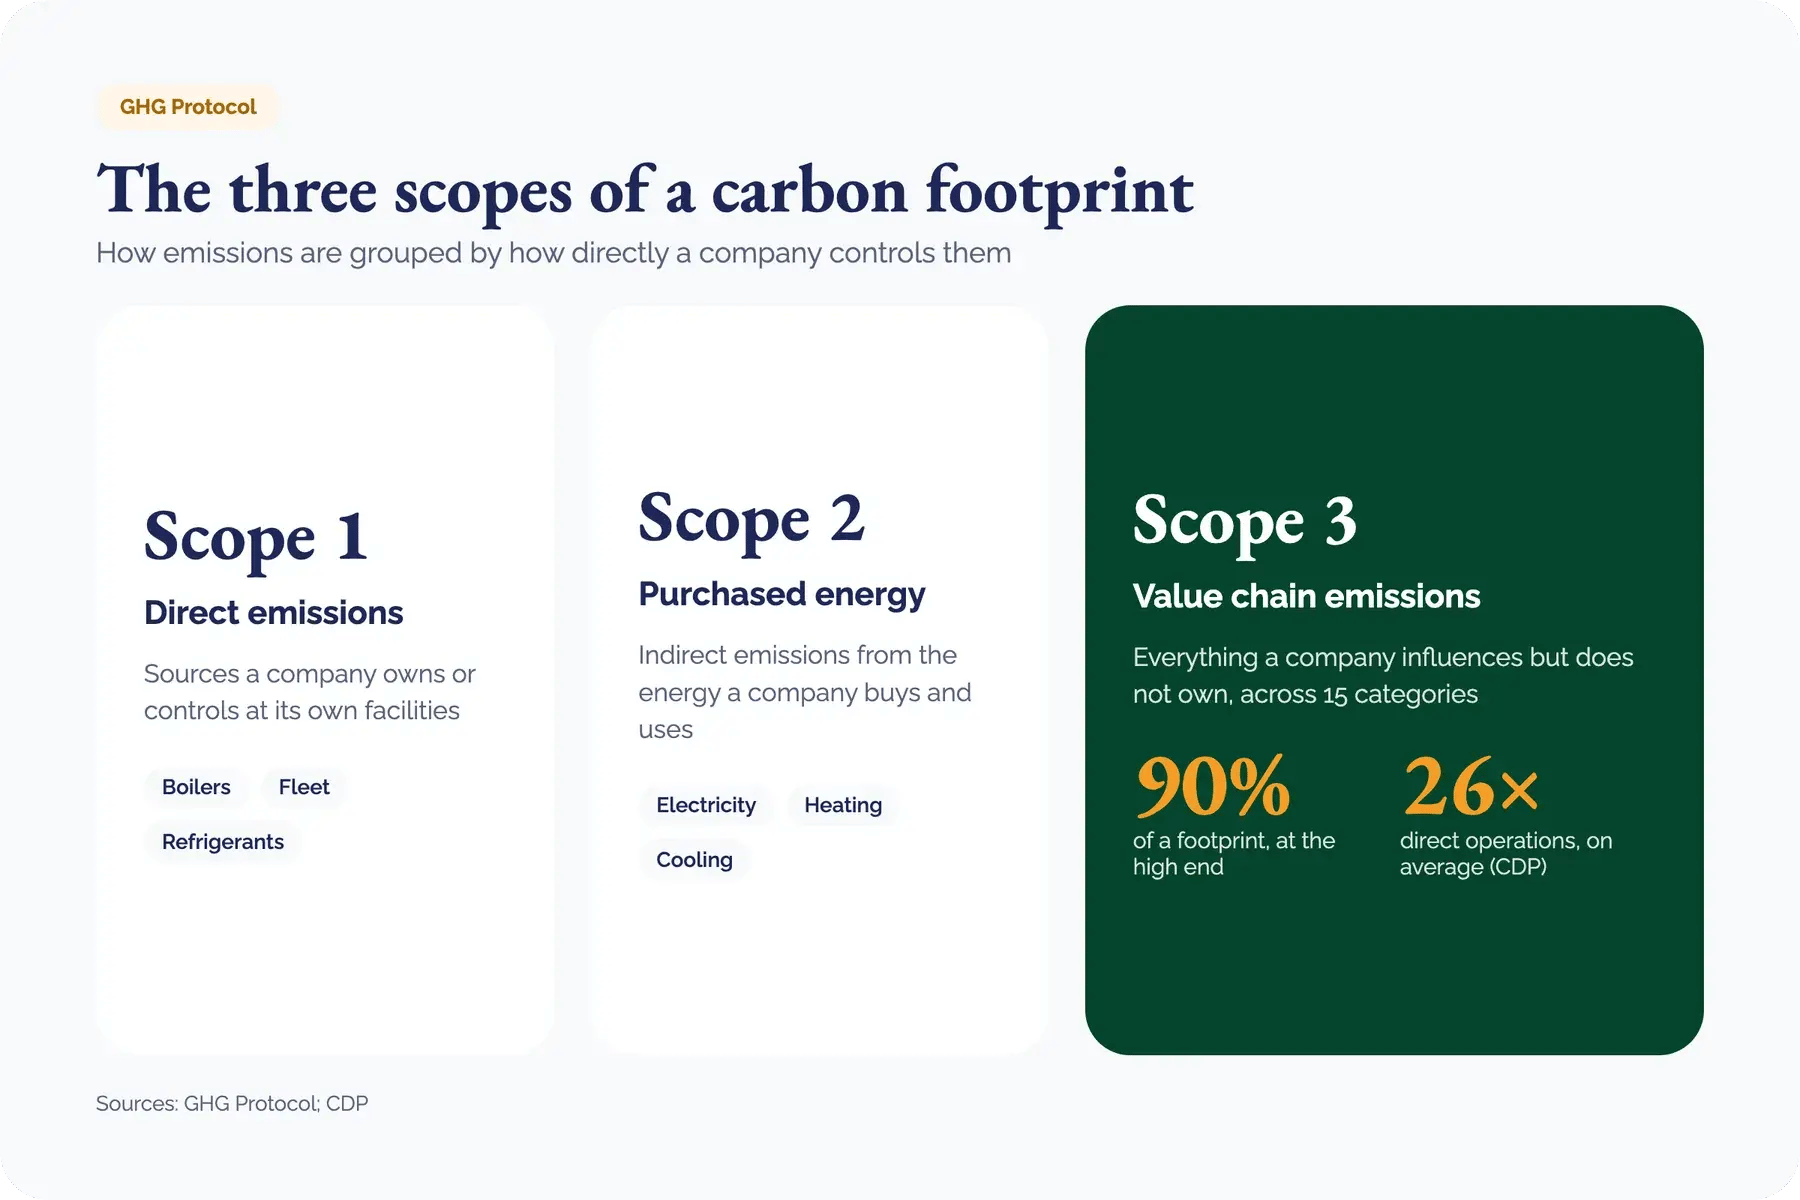 The three scopes of a carbon footprint under the GHG Protocol. Source: GHG Protocol; CDP.
Upstream activities within Scope 3 include:
- Purchased goods and services: The raw materials, components, and services a company buys, typically the single largest category for manufacturers and retailers.
- Capital goods: The equipment, machinery, and buildings a company acquires.
- Fuel and energy-related activities: The emissions of producing and delivering the fuel and energy a company uses, beyond what Scope 1 and 2 already capture.
- Upstream transportation and distribution: Moving purchased goods to the company.
- Waste generated in operations: Treating and disposing of waste from company activities.
- Business travel: Employee travel by air, rail, and road for work.
- Employee commuting: Staff travel between home and workplace.
- Upstream leased assets: Emissions from assets the company leases and operates.
Downstream activities within Scope 3 encompass:
- Downstream transportation and distribution: Moving sold products onward to customers.
- Processing of sold products: Further processing of a company's products by other businesses.
- Use of sold products: Emissions generated when customers use the products, often the largest category for makers of fuels, vehicles, and appliances.
- End-of-life treatment of sold products: Disposal or recycling of products once used.
- Downstream leased assets: Emissions from assets the company owns and leases to others.
- Franchises: Emissions from franchise operations.
- Investments: Emissions associated with a company's investments and financed activity.
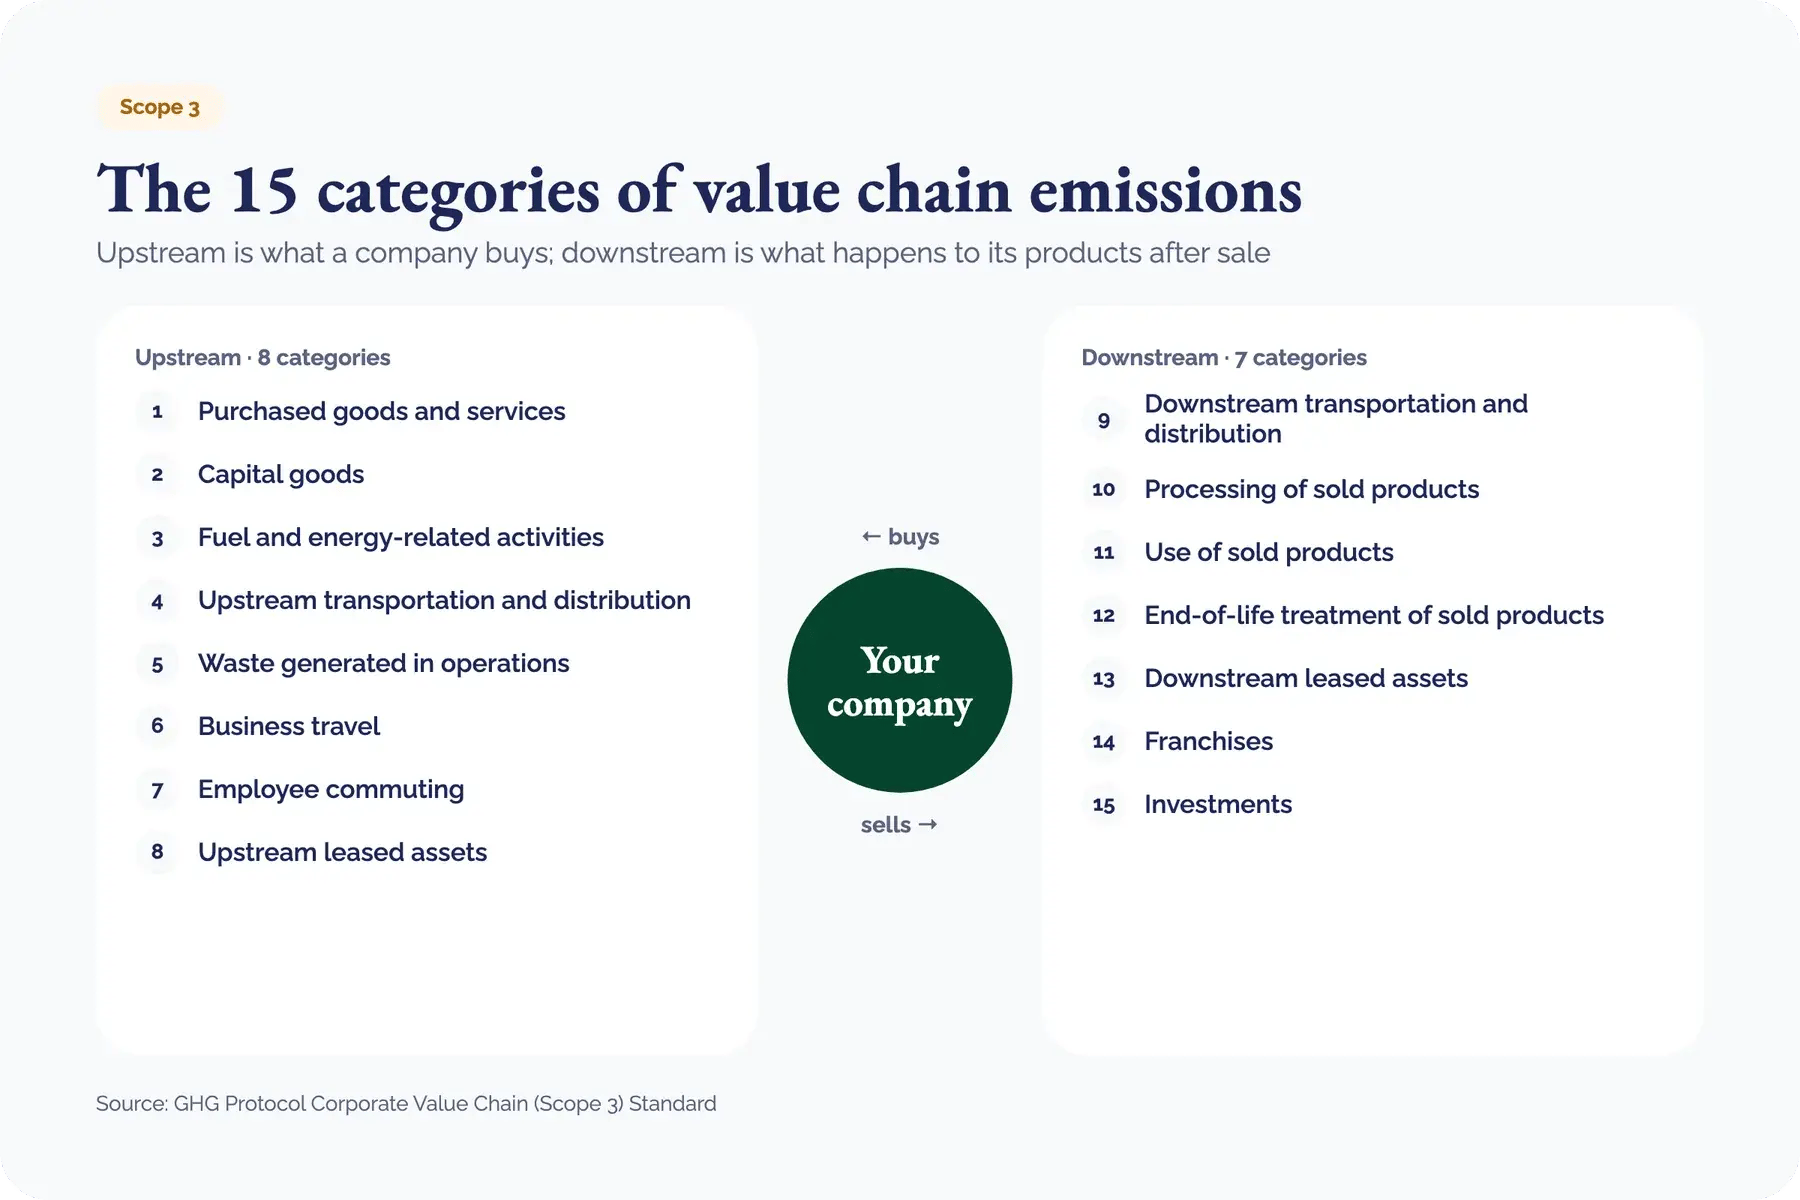 The 15 categories of Scope 3 emissions, upstream and downstream. Source: GHG Protocol.
Because Scope 3 spans the entire value chain, it is usually the largest part of a company's footprint and the hardest to quantify: The data sits with suppliers, customers, and partners rather than inside the company's own operations. That is why value chain emissions are where most of the reporting effort, and most of the reduction opportunity, is concentrated.
Read more: Why scope 3 emissions are your biggest blind spot—and what to do about it
For most organisations, Scope 3 represents the majority of the total. Companies reporting to CDP recorded supply chain emissions averaging 26 times their direct operations, and CDP estimates that Scope 3 accounts for approximately three-quarters of a typical company’s footprint. For manufacturers and retailers, purchased goods and services is usually the largest category within that total.
This distribution reframes the reporting task. A company addressing its footprint directs most of its effort towards purchased materials and suppliers rather than its own operations: the cotton in a garment, the plastic around a product, or the crop behind an ingredient. Each of these materials carries an emissions history that originates on a defined area of land, and accurate measurement depends on identifying that land.
Read more: The real cost of 1 tonne of CO2: Translating carbon into hectares
Cotton, linen, and the Aral Sea
A single garment demonstrates the difference that two sustainable materials decisions can produce. Cotton is among the most resource-intensive fibres in common use: producing 1 kg of cotton fabric requires approximately 10,000 litres of water as a global average, a substantial share of it drawn for irrigation in arid growing regions. In those regions, the water is diverted from finite local sources.
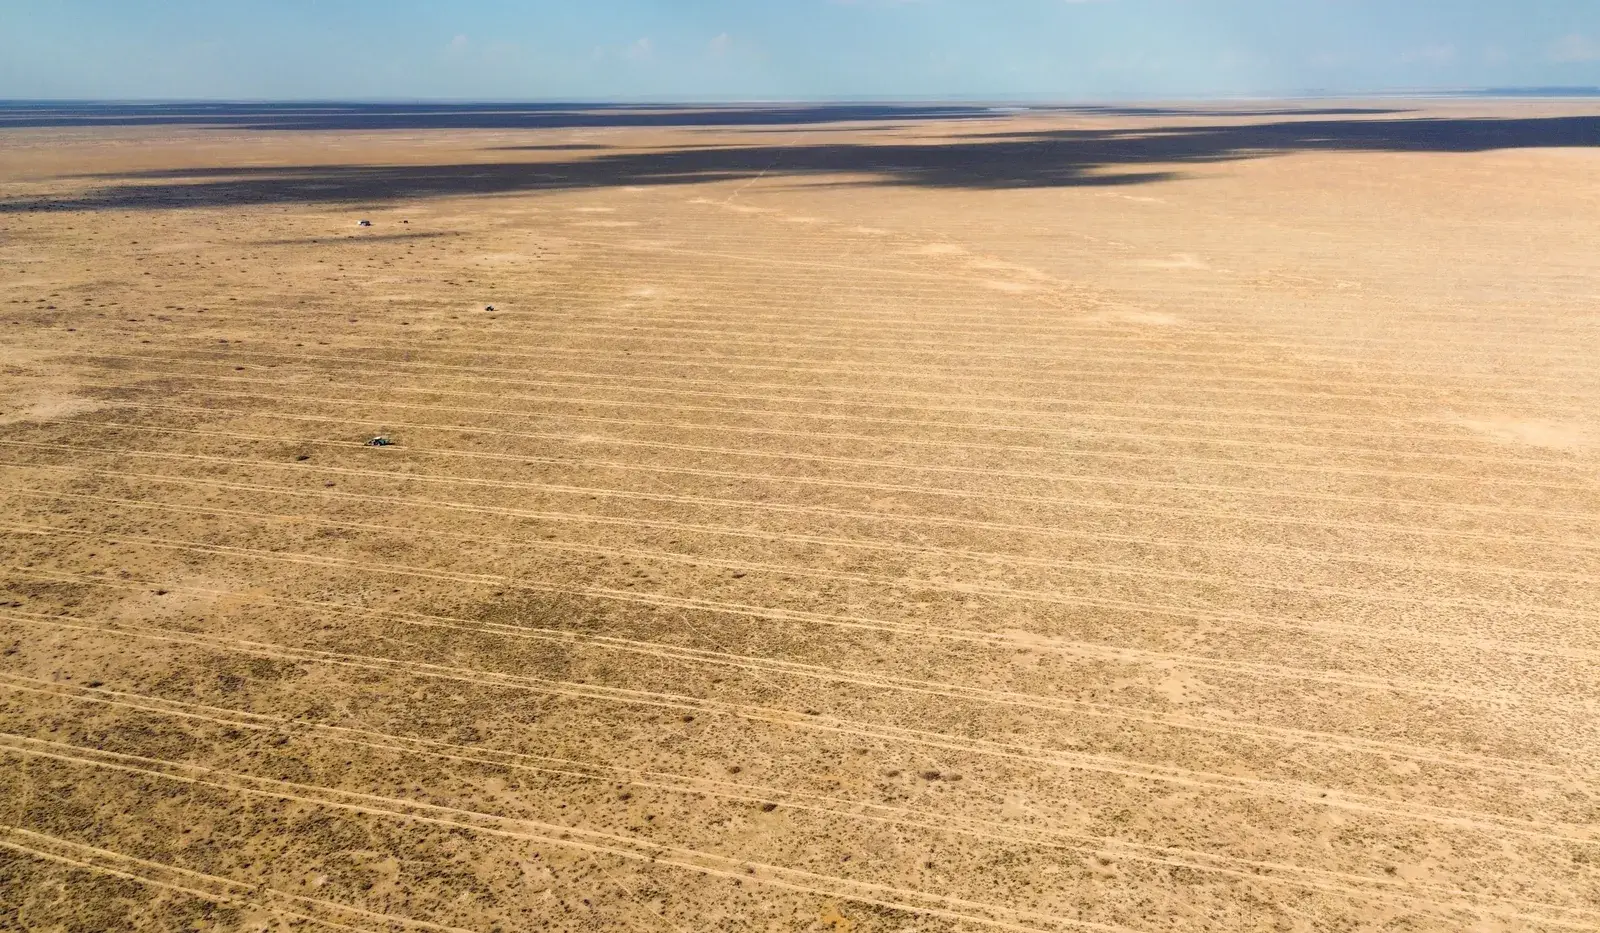
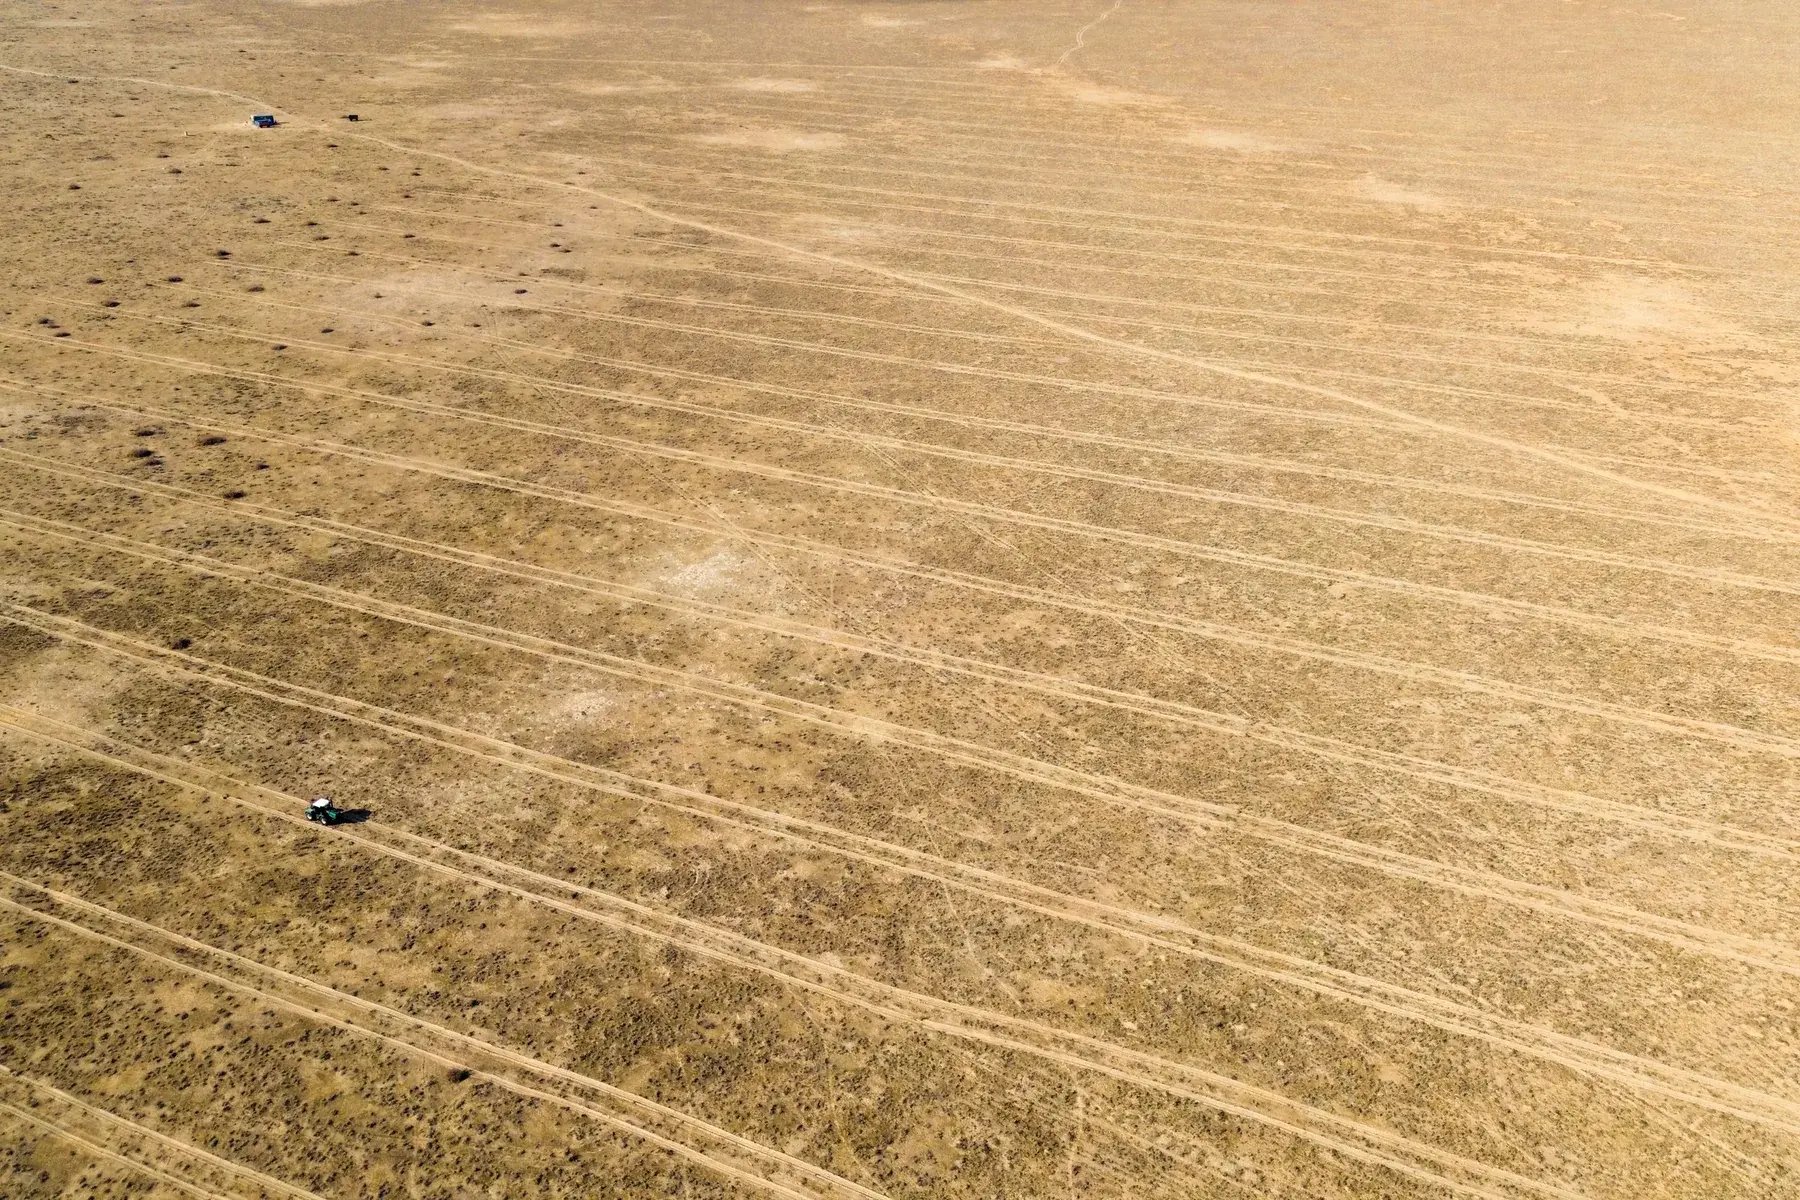 Rows of saxaul planted across the former bed of the Aral Sea - Greening of the Dried Aral Sea Project, Kazakhstan, Green Earth.
The consequences are documented on the border of Kazakhstan and Uzbekistan. The Aral Sea was once the fourth-largest inland body of water on Earth. From the 1960s, the two rivers feeding it were diverted to irrigate extensive cotton production across Central Asia, and the sea lost its inflow and receded into desert, leaving a saline plain and recurrent dust storms. Demand for a single commodity, transmitted through a supply chain, altered an entire landscape.
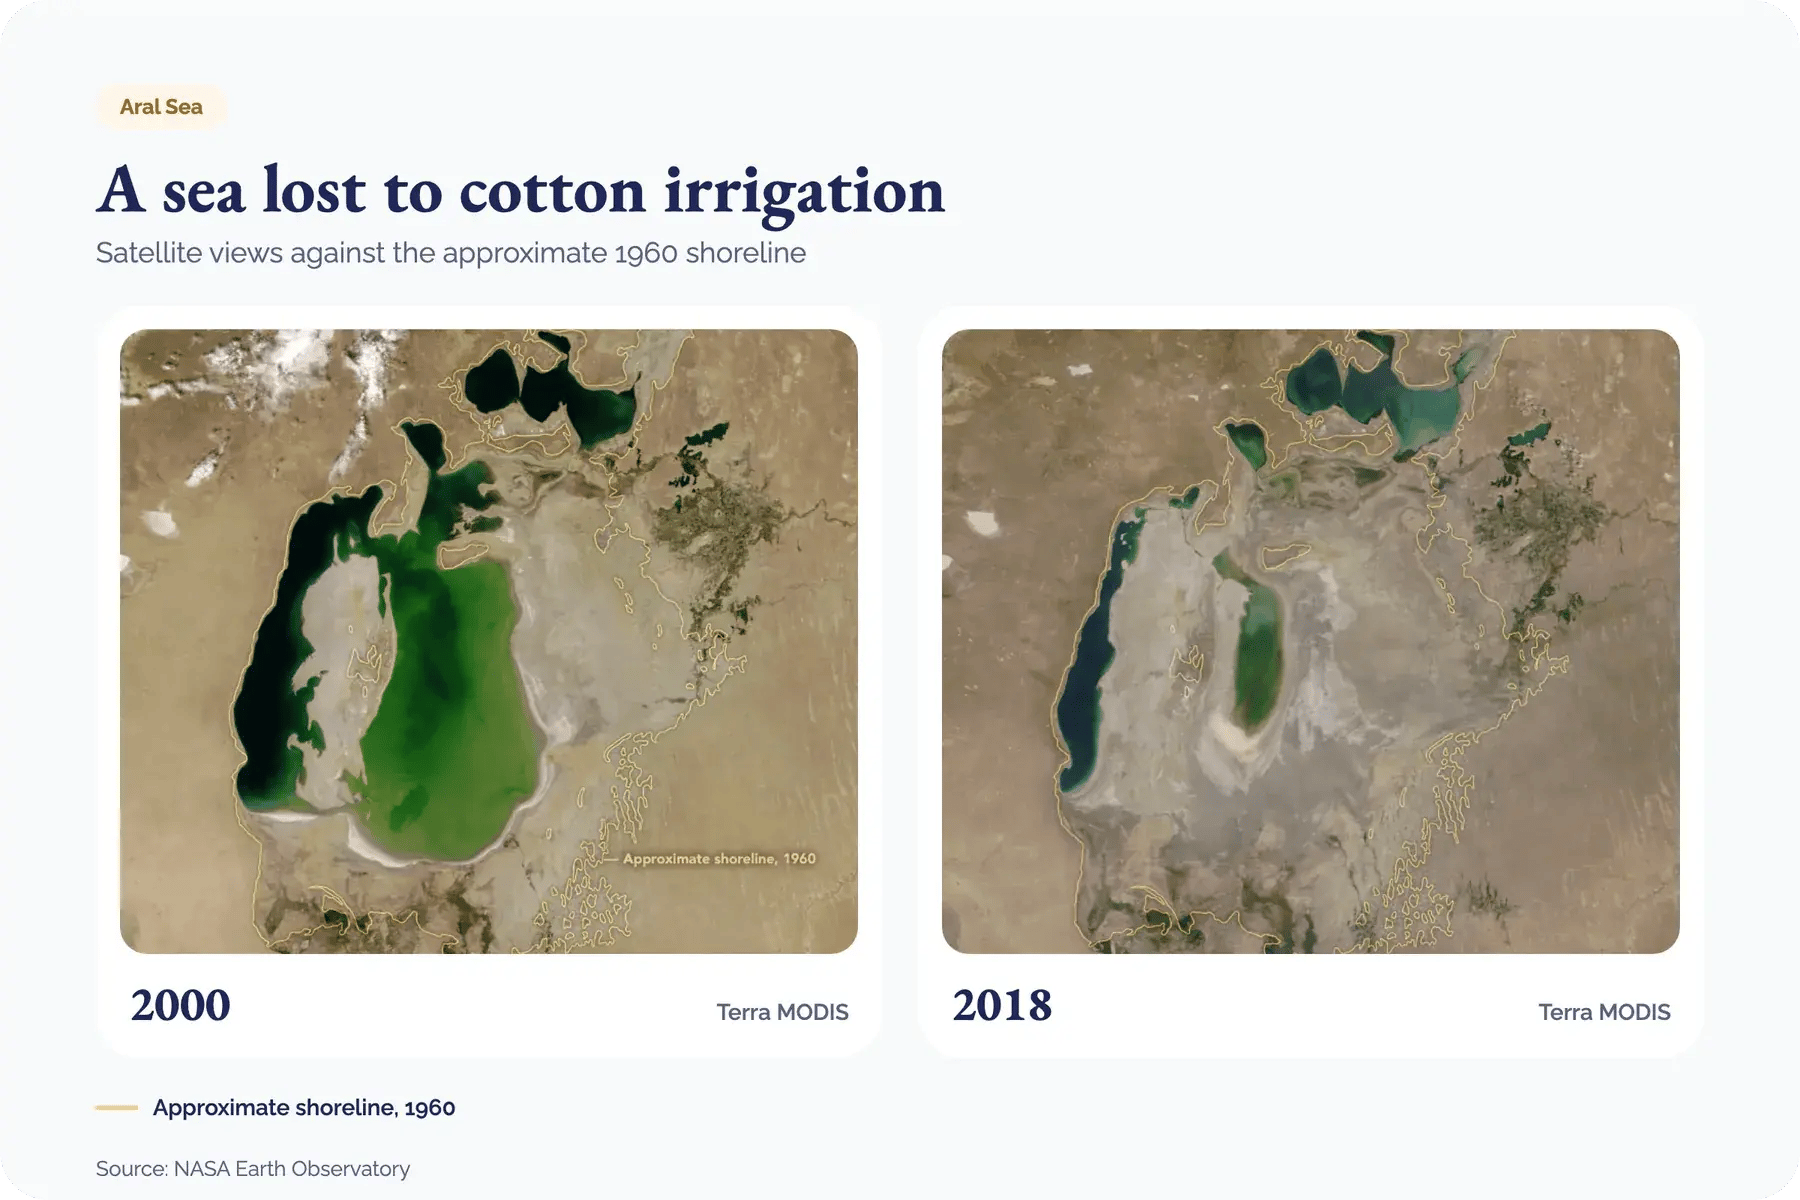 The Aral Sea in 2000 and 2018, compared with its approximate 1960 shoreline. Source: NASA Earth Observatory.
Linen presents a different profile. Woven from the flax plant, it is grown largely on rainfall in cooler European climates and requires considerably fewer pesticides and fertilisers than cotton. Research modelling global fibre production identifies flax as a materially more water-efficient alternative. The cotton vs linen environmental impact difference is significant, and it is recorded directly within a brand’s Scope 3 emissions: two comparable garments can carry very different land, water, and carbon profiles.
Spend-based accounting obscures this difference. When a footprint is estimated from expenditure rather than from the material itself, the specific field — its baseline condition and its water source — is absorbed into an industry average, and the land signal is lost.
Read more: Kazakhstan saxaul pilot points the way to scale-up
This is where a businesses’ contribution to restoration in specific areas becomes significant. On the former bed of the Aral Sea, Green Earth’s Greening of the Dried Aral Sea Project plants saxaul, a salt-tolerant species, to stabilise the soil, suppress dust, and re-establish an ecosystem on land degraded by intensive agriculture. Environmentally-savvy companies may choose to offset their hard-to-abate emissions through credits tackling the exact issues their commercial activity touches upon.

The carbon footprint of plastic packaging
The same principle applies to packaging. Products are frequently wrapped in plastic that serves its function for a short period and then becomes waste, which creates a plastic packaging carbon footprint on two sides of the value chain: fossil-based production upstream, and disposal downstream.
Read more: The ultimate guide to plastic credits
The scale is well documented. The world generated 353 million tonnes of plastic waste in 2019, of which packaging accounted for approximately 40%, the single largest source. Only 9% of plastic waste is recycled globally, and the plastics lifecycle produces around 3.4% of global carbon emissions, approximately 1.8 billion tonnes each year, the majority arising from production activities.
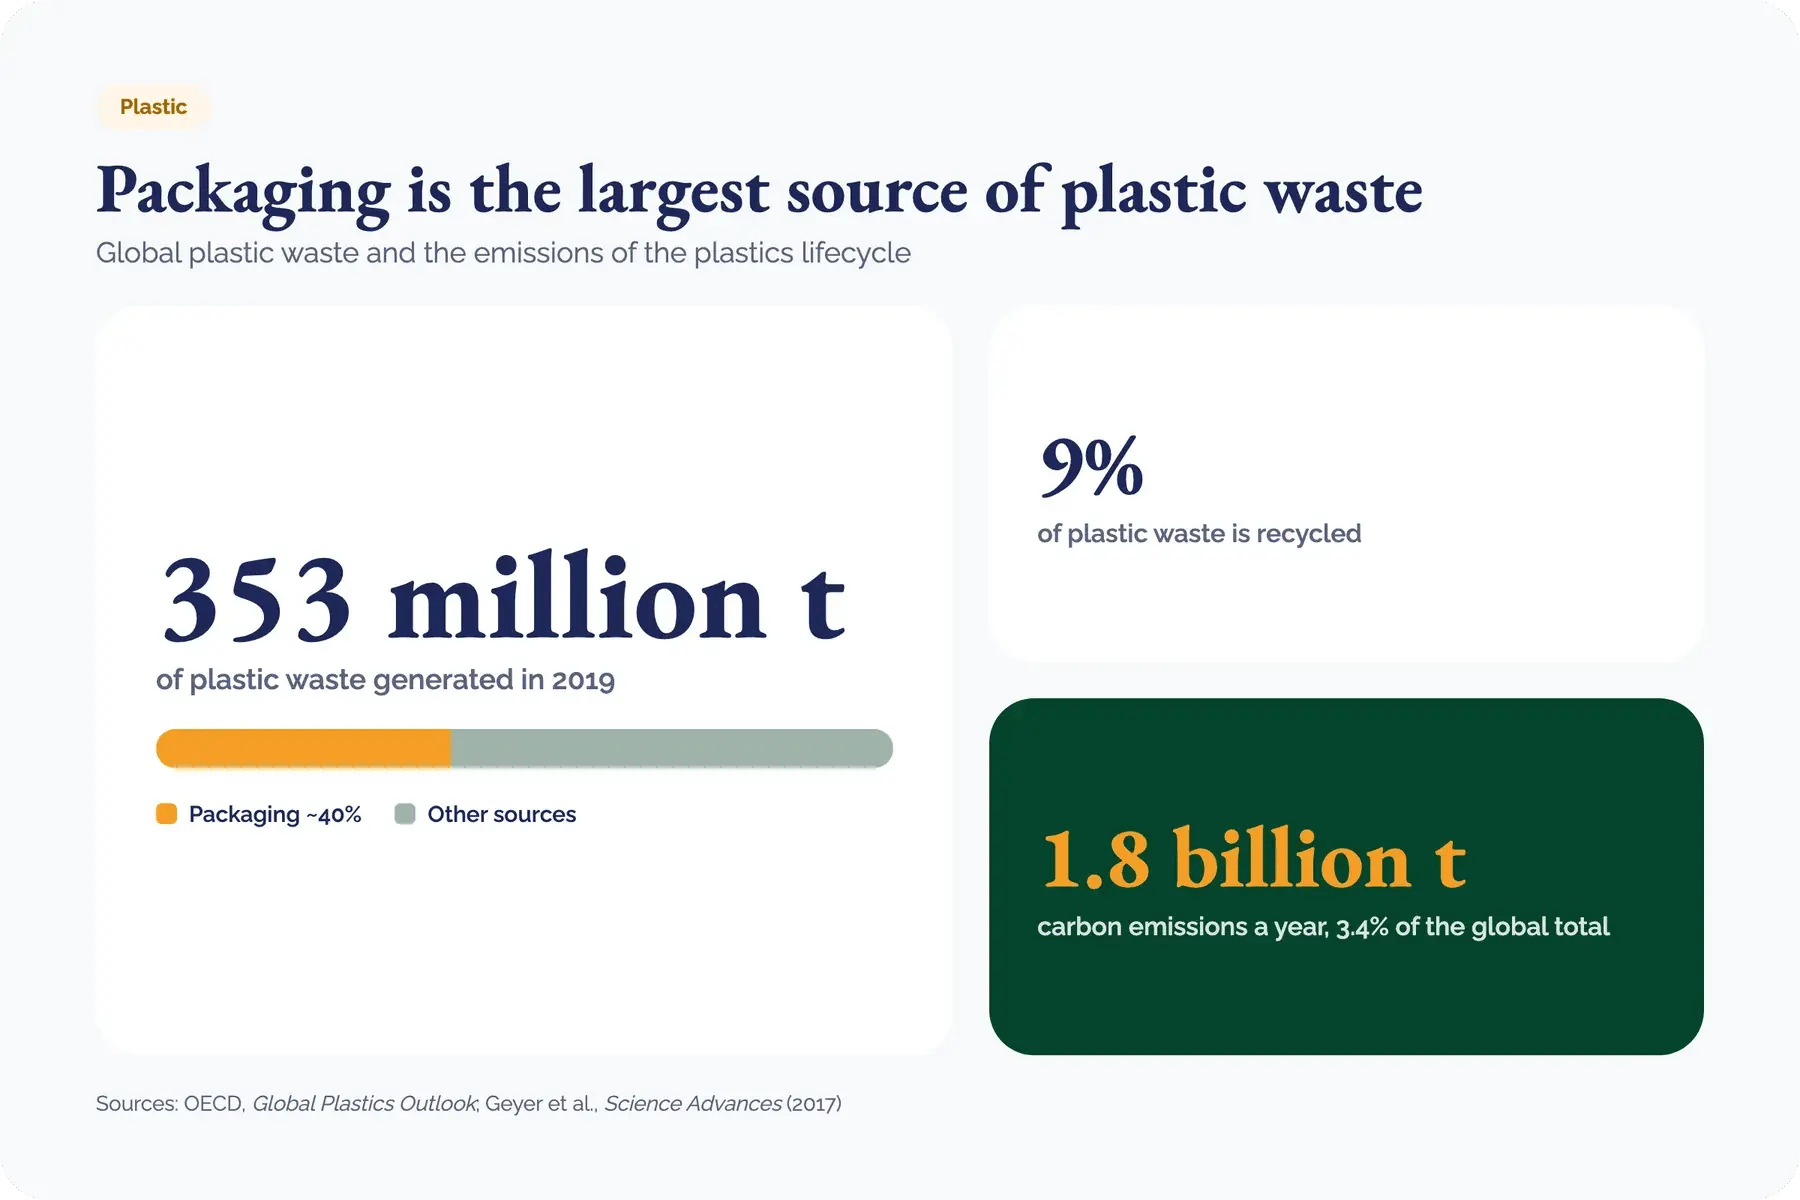 Global plastic waste and the carbon emissions of the plastics lifecycle. Source: OECD; Geyer et al., Science Advances.
For a brand, packaging appears in purchased goods upstream and in end-of-life treatment downstream, representing 2 of the 15 Scope 3 categories. Plastic that leaves a shelf and enters the natural environment is difficult to capture in a spreadsheet, and it remains one of the more challenging components of a footprint to reduce.
Get your Plastic Credits brochure
Green Earth offers a solution to tackling the footprint generated along this value chain as well. The Green Wheels Plastic Collection Project in Sri Lanka recovers plastic from beaches, riverbanks, and other natural areas using a fleet of locally manufactured electric bikes, in partnership with the recycling specialist Eco Spindles. The recovered material is processed into textile fibres, returning discarded packaging to productive use.
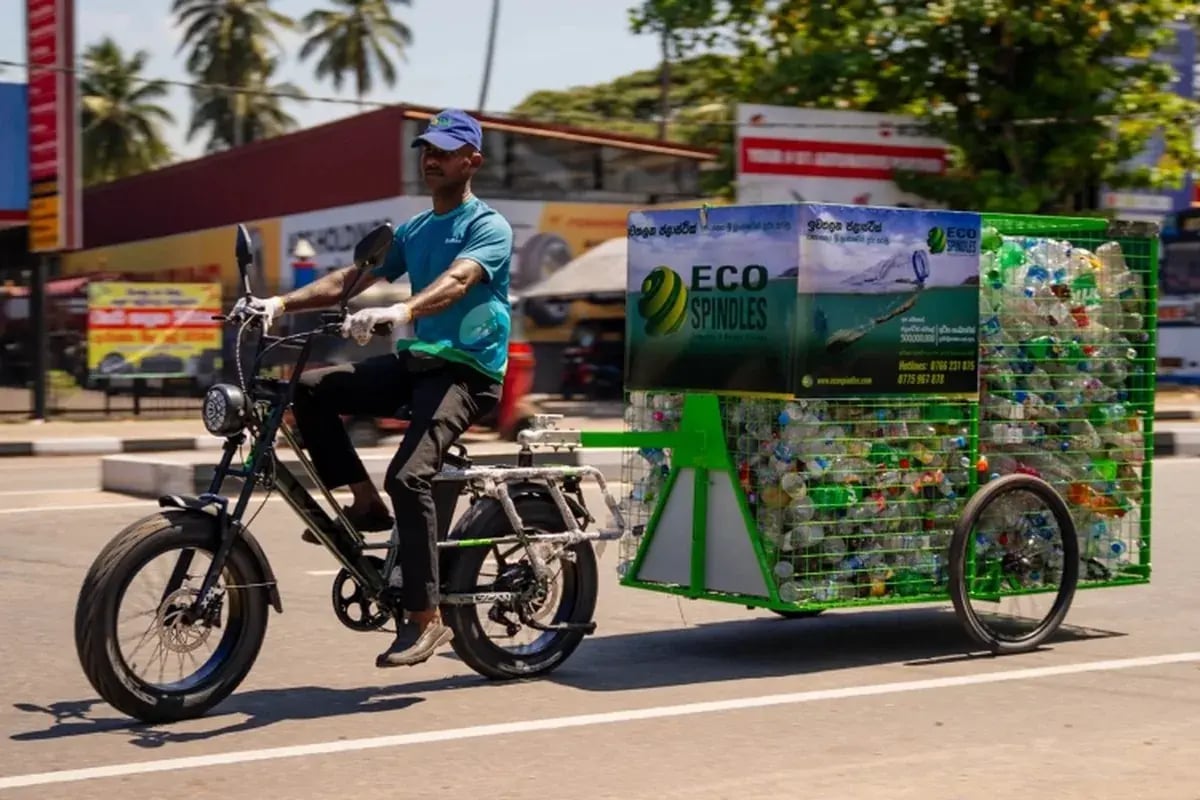 Green Wheels e-bike collecting plastic for recycling - Green Wheels Plastic Collection Project, Sri Lanka, Green Earth.
Why land-use data is the missing piece
Both examples point to the same conclusion. A footprint built on expenditure data indicates approximately how much a company emits. Establishing where those emissions originate, which materials drive them, and which procurement decisions would reduce them requires greater detail. Answering how to measure Scope 3 emissions with precision means tracing them to source: connecting each purchase to the land and the process behind it.
This is a need that the CO2 Expert business carbon footprint calculator responds to. It provides finance, procurement, and sustainability teams with carbon footprint measurement across all three scopes, at the level of detail required to identify which materials and suppliers carry the greatest weight. That detail converts a reporting obligation into a decision-making instrument, indicating where a change of material or supplier produces a genuine reduction, and it generates the structured record that frameworks such as the CSRD now require.
Read more: Net zero needs nature: a carbon credit guide
Accurate land-use data closes the gap between a figure on a disclosure and the landscape it represents. Once a company can see that connection clearly, it can act on it and measure the effect of restoration.
From measurement to restoration
Green Earth pairs the measurement of companies’ environmental footprints with the means to act on it. To tackle irreducible emissions, we built the carbon credit marketplace, where we supply verified carbon credits from global projects that lets your business compensate for the emissions remaining in its value chain. Many of those credits come from Green Earth's own nature-based projects, such as the Greening of the Dried Aral Sea Project, which plants saxaul across the former Aral seabed to restore land degraded by intensive agriculture.
A company's plastic footprint is distinct from its carbon footprint, and Green Earth addresses it through a separate initiative. The Green Wheels Plastic Collection Project recovers plastic along the Sri Lankan coastline, helping companies tackle their plastic footprint. In each case, the land and coastlines that a supply chain depends upon are the ones being restored.
For any organisation, the first step is the clearest: understand the footprint before reducing it. The CO2 Expert tool identifies precisely where a company’s Scope 3 emissions begin, providing the basis for deciding where to act.