
Carbon credits
Nature conservation
Nature-based solutions
Carbon footprint
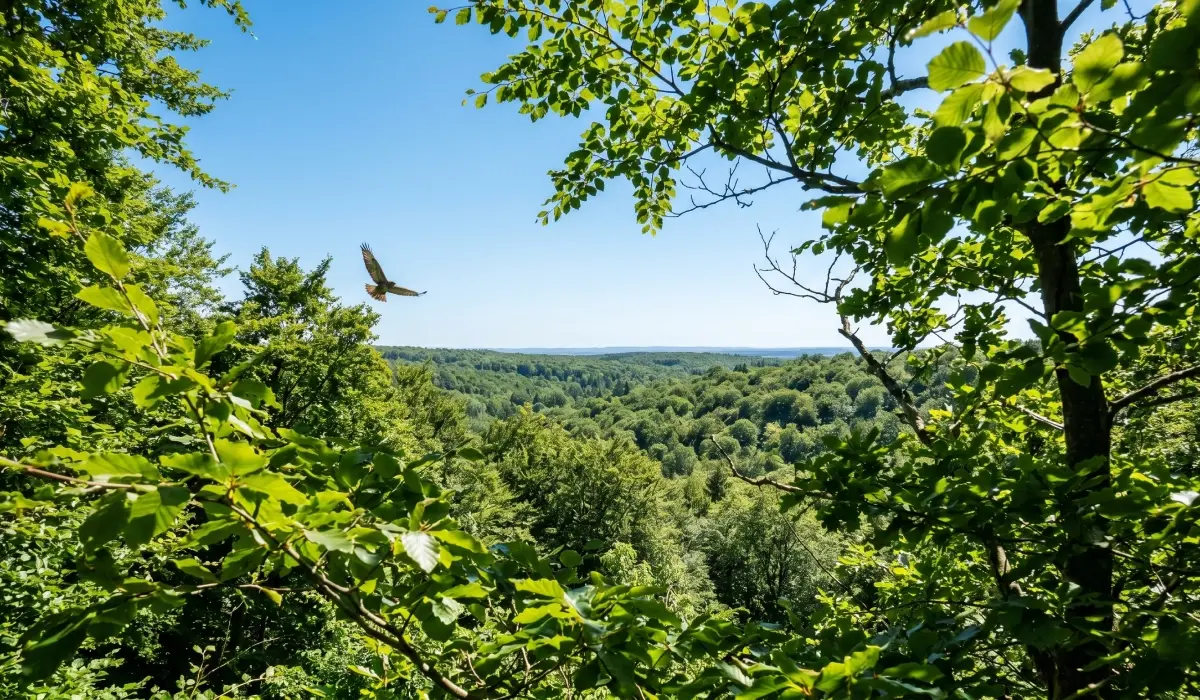
Every business carbon footprint report ends with a number, the amount of carbon emissions produced by the business, less the amount of carbon reduced and offset, given in tonnes of CO₂. Many of the people who sign off on that number, including those who paid for it, cannot picture what it represents on the ground. A tonne is a unit of mass. CO₂ is invisible. The link between the amount offset in the report and a real piece of restored forest somewhere in the world is almost never indicated.
But that link exists, and it runs through a clear chain: a business measures its footprint, reduces what it can at the source, and compensates for the residual by buying carbon credits. Each credit funds 1 tonne of CO₂ stored in a real, verified nature-based project. That stored tonne, in turn, translates to a specific area of restored land.
This article walks through every link in that chain, using verified science, so that footprint, credits, tonnes, and hectares stop being separate ideas and become one connected story.

What does 1 tonne of CO₂ mean, and why do the usual analogies fall short?
1 tonne of CO₂ is 1,000 kg of carbon dioxide gas. It is the standard accounting unit in every footprint report, in the voluntary carbon market, and in national reporting under the Paris Agreement. It is also what one verified carbon credit represents: 1 tonne of CO₂ either reduced, removed, or avoided through a verified project.
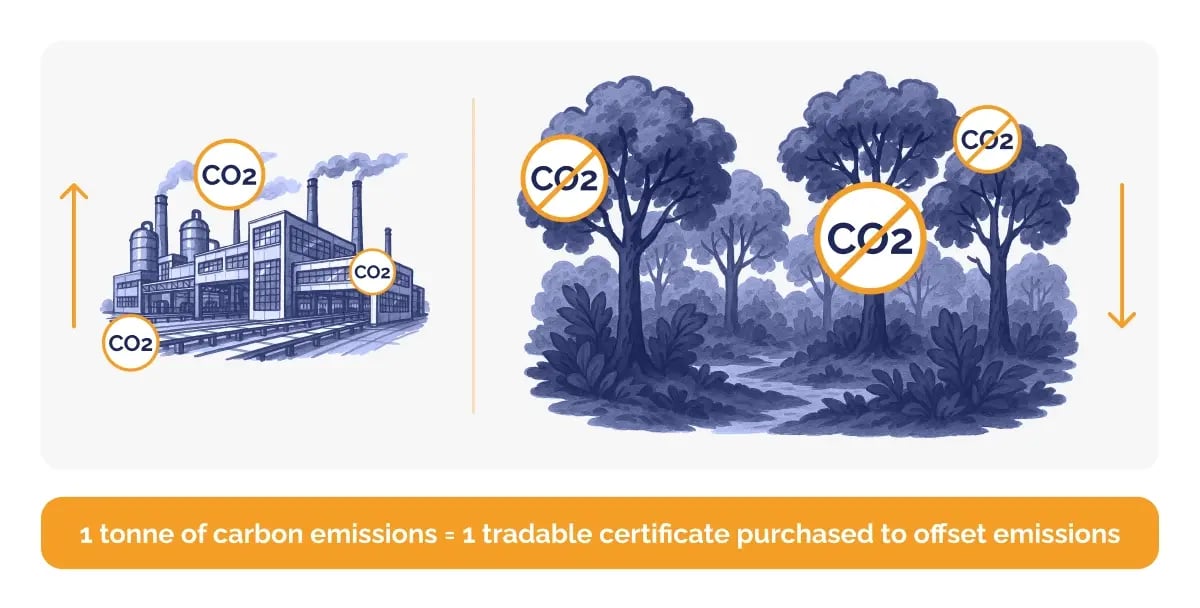 How carbon credits work illustration.
In day-to-day comparisons, 1 tonne of CO₂ is roughly two-thirds of the electricity use of an average European household for a year, a one-way long-haul flight in economy class of around 6,000 km—London to Nairobi, for example—or driving a petrol car for about 5,000 km.
Read more: Industries with the biggest nature footprints and what their decarbonisation looks like
These analogies are useful in that they show what produces a tonne. They do not, however, show what that tonne represents inside an intact ecosystem, which is the picture a business needs in order to know what its credits are funding. That second view is the one this article builds.
The chain: From footprint to hectares of restored forest
A credible corporate response to carbon emissions follows a four-step structure: measurement, reduction, compensation, and translation.
- Measurement. The business calculates its full carbon footprint across Scope 1, Scope 2, and Scope 3 emissions in line with recognised standards, such as the GHG Protocol and ISO 14064. An accurate inventory is the basis of every decision that follows; without it, reduction targets are unanchored and compensation volumes cannot be verified.
- Reduction. Emissions that can be reduced at the source, through energy efficiency improvements, supplier requalification, fleet electrification, or process redesign, are addressed with carbon reduction strategies.
- Compensation. The residual emissions, those that cannot yet be reduced at the source, are compensated for through the purchase of verified carbon credits. Each credit represents 1 tonne of CO₂ reduced, removed, or avoided through a project certified under a recognised carbon standard.
- Translation. Each verified credit corresponds to a specific, measurable area of a restored ecosystem. This is the link that footprint reports rarely make explicit.
Read more: Why scope 3 emissions are your biggest blind spot—and what to do about it
Understanding the basics: How much carbon does a tropical forest store?
A tropical forest is one of the densest carbon stores on land. The carbon sits in living biomass above ground—trunks, branches, leaves—and below ground in roots, leaf litter, and soil.
The numbers are well documented. According to the FAO's Forest Resources Assessment 2025, global forests hold around 714 gigatonnes of carbon, with tropical primary forests carrying the densest stocks at 200 to 300 tonnes per hectare. Field measurements in African tropical forests record an average of 260 tonnes of aboveground biomass per hectare, which converts to roughly 480 tonnes in total of CO₂ per hectare.
Scientists estimate the carbon a tree holds using equations called allometric models. These take measurable parameters—trunk diameter, tree height, and the density of the wood—and turn them into a biomass figure. Wood density matters more than people expect. Between two trees of identical size, the one with denser wood stores more carbon.
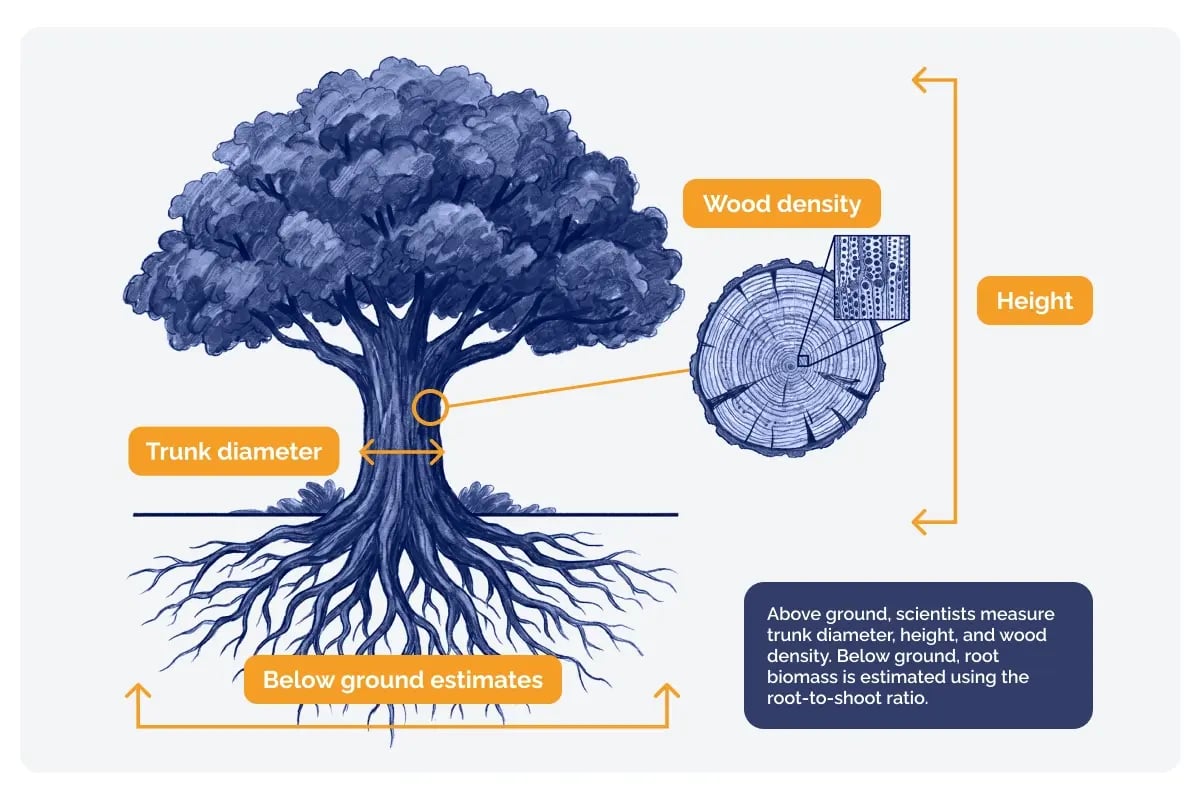 Above ground, scientists measure trunk diameter, height, and wood density. Below ground, root biomass is estimated using the root-to-shoot ratio.
The trade-off is accuracy. In the tropics, this kind of estimation carries an uncertainty of around 15% to 20%, which is the price of estimating biomass rather than measuring it directly. Direct measurement would mean cutting the tree down.
Roots are harder to measure. You cannot measure them properly without damaging the tree, so scientists use a method called the root-to-shoot ratio, which estimates how much biomass sits underground based on what is visible above it.
Read more: Beyond tonnes: How carbon credit co-benefits elevate value
Mature forests store even more carbon. A study at Monteverde, Costa Rica, recorded up to 447 tonnes of CO₂ per hectare in aboveground biomass in a mature tropical forest, while secondary forests recovering from disturbance hold roughly 200 to 250 tonnes per hectare.
In a tropical biodiversity hotspot like the Eastern Arc Mountains of Tanzania, carbon density in forest plots ranges from around 370 to 668 tonnes of CO₂ per hectare, with the highest figures recorded in the most undisturbed, high-altitude plots. The figure varies with rainfall, soil, elevation, and disturbance history, but the order of magnitude is consistent: a tropical forest holds several hundred tonnes of CO₂ in every hectare of intact ground.
Read more: Why a forest with more species stores more carbon
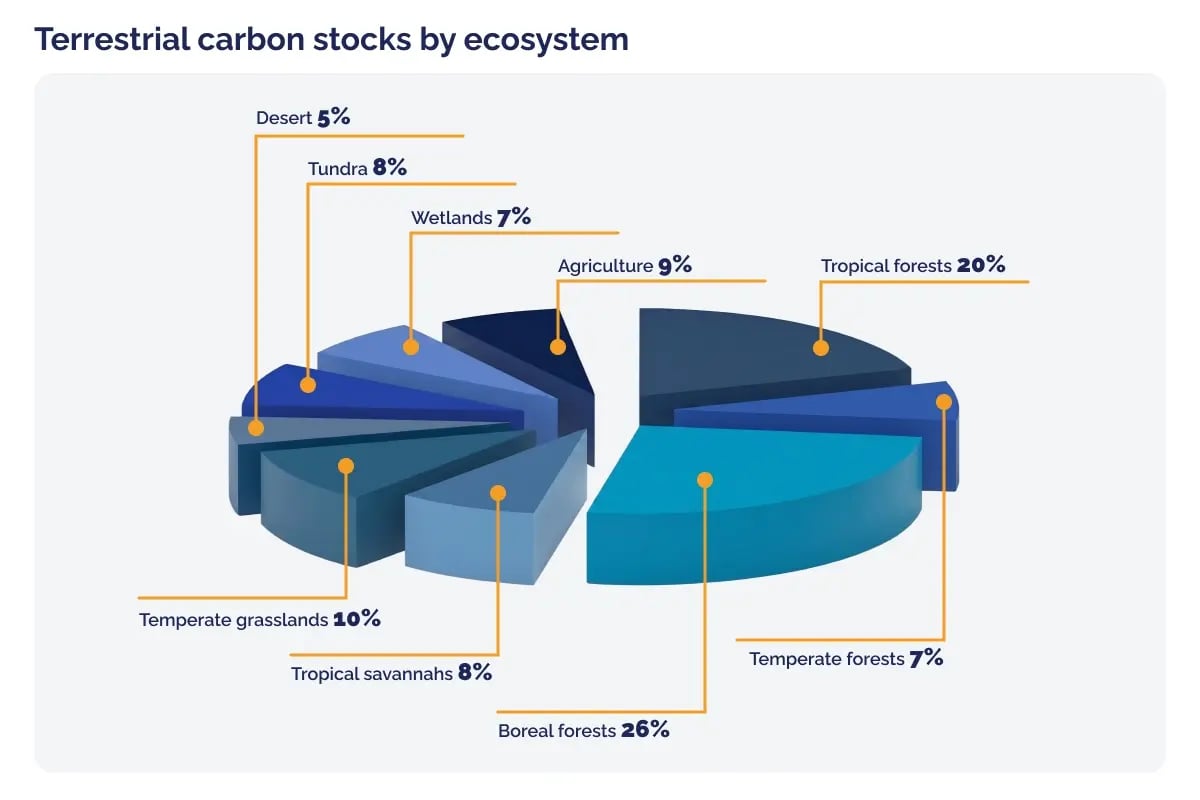 Terrestrial carbon stocks by ecosystem. Source: https://www.fao.org/4/y0900e/y0900e06.html
Restoration projects rebuilding cover on previously cleared land typically sit at the lower end of that range in their early years, then climb steadily as the forest matures. This is why high-quality carbon projects rely on more conservative numbers—the credit accounting must hold up to scrutiny even when the forest is at its early, lower-storage stage.
It is also important to note here that these restoration carbon projects would not have occurred without the carbon credit financing, which is called additionality. They may therefore initially store less carbon than old-growth forests, but ultimately they play a vital role in restoring degraded forests and ecosystems worldwide and capturing millions of tonnes of emissions to lower global CO2 levels.
Translating a credit into a piece of restored land
The translation step of what your purchased carbon credits represent is where the chain produces a measurable, communicable result. Restoration projects developed under recognised carbon standards sequester carbon at a conservative average of around 11–12 tonnes of CO₂ per hectare per year, accumulated over a typical project lifetime of 41 years for an afforestation, reforestation and revegetation (ARR) project. That gives a cumulative draw-down of approximately 200–490 tonnes of CO₂ per hectare across the full project period—a figure consistent with FAO data on tropical forest sequestration applied to verified restoration timelines, and the conservative benchmark on which credible carbon accounting depends.
Read more: Indigenous and local knowledge in carbon projects: why it defines credit quality
Dividing 1 hectare (10,000 square metres) by 490 tonnes yields the unit translation that underwrites the entire chain: 1 tonne of CO₂ compensated through a verified carbon credit corresponds to approximately 20 square metres of restored forest, roughly the floor area of a double garage, and, at an average planting density of 350 trees per hectare in ARR restoration projects, 1 credit represents approximately 1 tree planted.
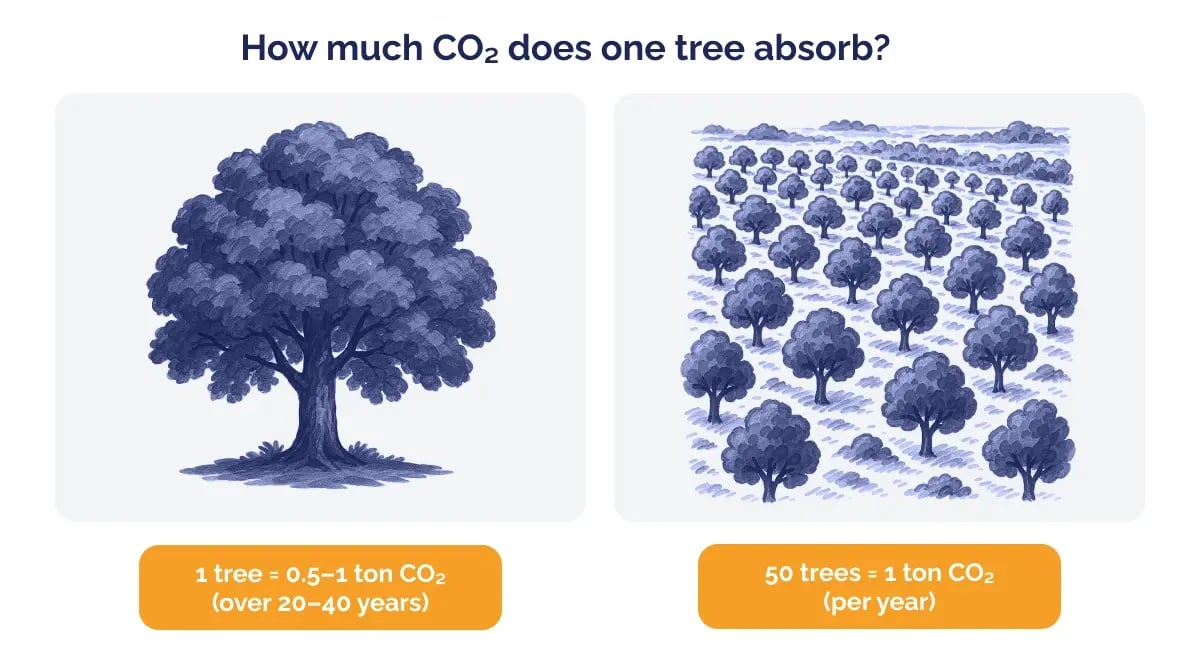 How much CO₂ does one tree absorb?
This represents the area of restored canopy, undergrowth, root system, and topsoil funded by a single credit. Applied across a typical corporate residual, the translation produces the following equivalences:
- A 30-tonne footprint, representative of a small office after reductions, corresponds to approximately 600 square metres of restored forest, and around 21 trees planted.
- A 500-tonne footprint, in the realistic range for a 50-person service company once Scope 3 emissions are included, corresponds to approximately 1 hectare, or roughly the area of a rugby field, around 350 trees planted.
- A 5,000-tonne footprint, typical of a small manufacturer, corresponds to approximately 10 hectares, or roughly 14 football pitches of forest, and around 3,500 trees planted as a direct consequence of the company's compensation strategy.
This is the practical meaning of translating carbon into hectares. A figure on a footprint report becomes a defined, measurable area of restored land, and a countable number of trees, funded by the business's compensation decisions. This is where the value lies in carbon compensation. Not as a shortcut for reductions, but as an immediate way to address irreducible emissions by funding tangible and measurable restoration on the ground.

The overlooked link in the chain: How biodiversity sustains carbon storage
The translation from credit to hectare is mathematically straightforward, but it holds only if the restored forest continues to sequester carbon over time. This is not automatic. A forest remains a functioning carbon sink only as long as the ecosystem within it remains intact, and that depends on the wildlife it contains.
Read more: How carbon project developers quantify biodiversity and community impact
A 2025 study published in PNAS examined what happens to tropical forest carbon uptake when seed-dispersing animals disappear. The result was striking: regrowing tropical forests with healthy populations of seed-dispersing animals absorbed up to four times more carbon than similar forests with reduced animal biodiversity. The loss of these animals corresponded to a 57% reduction in carbon uptake, averaging 1.8 tonnes of CO₂ per hectare per year.
The mechanism is simple. The large-fruited tree species that store the most carbon depend on large-bodied animals, like primates, hornbills, large frugivorous birds, and ground-dwelling mammals, to swallow their seeds and carry them, intact, to new ground. When there are no such animals, the seeds drop directly under the parent tree, die from competition, and the next generation of carbon-dense species fails to recruit. The forest stays standing, but its capacity to keep storing carbon collapses.
The translation from credit to hectare assumes the restored forest continues to function as a carbon sink. This assumption holds only when the wider ecosystem remains intact over the long term. A credible project developer, therefore, measures and manages biodiversity as a core component of credit quality, and keeps monitoring and managing the project over its lifetime. Green Earth's projects are designed and managed on this basis, with biodiversity and ecosystem health at the foundation of our projects and long-term stewardship and strict ongoing monitoring at the core of our model.
Read more: Carbon credit project stewardship: what happens after credit issuance
What this means for your business footprint
The chain begins with measurement. Until your business knows its footprint, there is nothing to reduce, nothing to compensate for, and no figure to translate into restored land. Without measurement, how would you know what that footprint typically looks like in practice?
At the per-capita level, the average annual carbon footprint for an individual in the United States is approximately 16 tonnes of CO₂ equivalent. The European per-capita average sits closer to 6 to 10 tonnes.
Business footprints, however, do not scale linearly with headcount, because most of a company's emissions sit upstream and downstream of its own operations. According to the British Business Bank, Scope 3 emissions often account for over 70% of an organisation's total footprint, meaning the figures most companies see in their first Scope 1 and 2 inventory significantly understate their real exposure.
The Carbon Trust reports that the average UK SME generates around 15 tonnes of CO₂ equivalent per year on Scope 1 and Scope 2 alone, with office-based SMEs averaging roughly 3.7 tonnes per employee per year on the same basis. Once Scope 3 is added in line with the GHG Protocol, the per-employee figure typically rises to between 2 and 10 tonnes for service-led businesses, 10 to 50 tonnes for product brands without in-house manufacturing, and higher again for manufacturers and logistics-heavy operators. Scaled to company level, these figures translate into total annual footprints in the low hundreds of tonnes for a small service business, into the thousands for product brands, and into the tens of thousands for manufacturers with international supply chains.
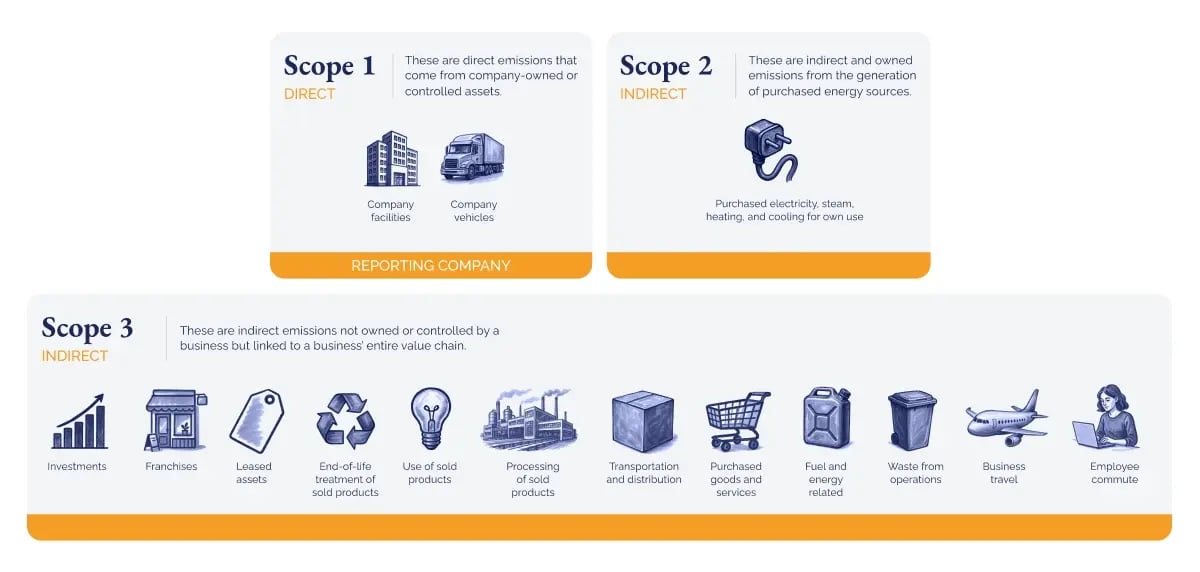 3 scopes illustrations.
To illustrate this in practice, three indicative examples translate the per-employee figures into measurable corporate footprints and the restoration ground they represent:
- A 15-person service business with an office could carry an estimated annual footprint of around 90 tonnes of CO₂ equivalent once Scope 3 is included (approximately 6 tonnes per employee). Compensating that footprint through verified carbon credits corresponds to roughly 1,800 square metres of restored tropical forest—close to one-fifth of a hectare, and around 64 trees planted at a standard restoration planting density.
- An 80-person product brand without in-house manufacturing could carry an estimated annual footprint of around 2,000 tonnes (approximately 25 tonnes per employee). Compensating that footprint corresponds to roughly 4 hectares of restored forest, and around 1,420 trees.
- A 250-person manufacturer with international supply chains could carry an estimated annual footprint of around 15,000 tonnes (approximately 60 tonnes per employee). Compensating that footprint corresponds to roughly 30 hectares of restored forest, and approximately 10,600 trees planted.
These figures are illustrative rather than diagnostic; the actual footprint of any given business depends on its operations, supply chain, and reduction strategy. The point is the order of magnitude: The gap between a Scope 1 and 2 estimate and a properly accounted full-scope footprint is typically a factor of three to five.
Read more: Emissions accounting without an ESG team: achieving the best of both worlds for SMEs
An accurate footprint is the starting point for every meaningful decision a business makes about its environmental impact. Without it, reduction targets are guesswork and compensation strategies have no anchor. With it, three questions become possible to answer.
 CO2 expert tool.
A measured footprint enables decisions that no business can take credibly without one: which emissions to reduce at the source, where in the value chain to prioritise intervention, and what hard-to-abate emissions remain that need to be compensated for.

How to make carbon footprint data tangible
Footprint reports now serve multiple internal and external audiences, including employees, customers, board members, and regulators. Communicating the same data, and your carbon offset impact, credibly across these audiences requires a consistent set of principles:
- Get the footprint itself validated before communicating it. A number that has not been validated against a recognised standard (ISO 14064, the GHG Protocol, or equivalent) is not a footprint, it is an estimate. Any external communication based on an unverified figure carries reputational and, increasingly, regulatory risk.
- Anchor your offsets in the nature-based project the credits actually come from. The forest, peatland, or mangrove the business is contributing to has a greater effect than a generic ecosystem reference, because it gives stakeholders a real place to picture, and a project name that can be checked against the public registry record.
- Use a unit the reader can hold in their hand. Square metres of forest, hectares, anything visual. Tonnes alone are abstract; tonnes plus a reference are concrete.
- Match the marketing wording to what the project actually delivers. A credit retired against a verified carbon standard supports a reduction or removal claim. It does not make the business ‘carbon neutral’ unless the underlying inventory, reduction targets, and credit volumes all hold up to scrutiny. Language like contributing to climate action or compensating for unavoidable emissions is more defensible than net zero applied loosely.
- Report the social co-benefits alongside the carbon figure. Most credible nature-based projects deliver measurable outcomes on local livelihoods, biodiversity, water quality, or gender equality. These are part of what the credit represents and they belong in the same paragraph as the tonnes.
Effective translation is what converts a footprint report from a compliance document into a decision-making tool, a competitive advantage, and a marketing mechanism.
Read more: The hidden strength of nature-based credits in corporate decarbonisation strategies
How Green Earth turns your footprint into measurable restoration
Green Earth develops nature-based projects from end to end, with full supply-chain oversight. The Bulindi Agroforestry and Chimpanzee Conservation Project in Western Uganda is a prime example, and it illustrates every point this article has made.
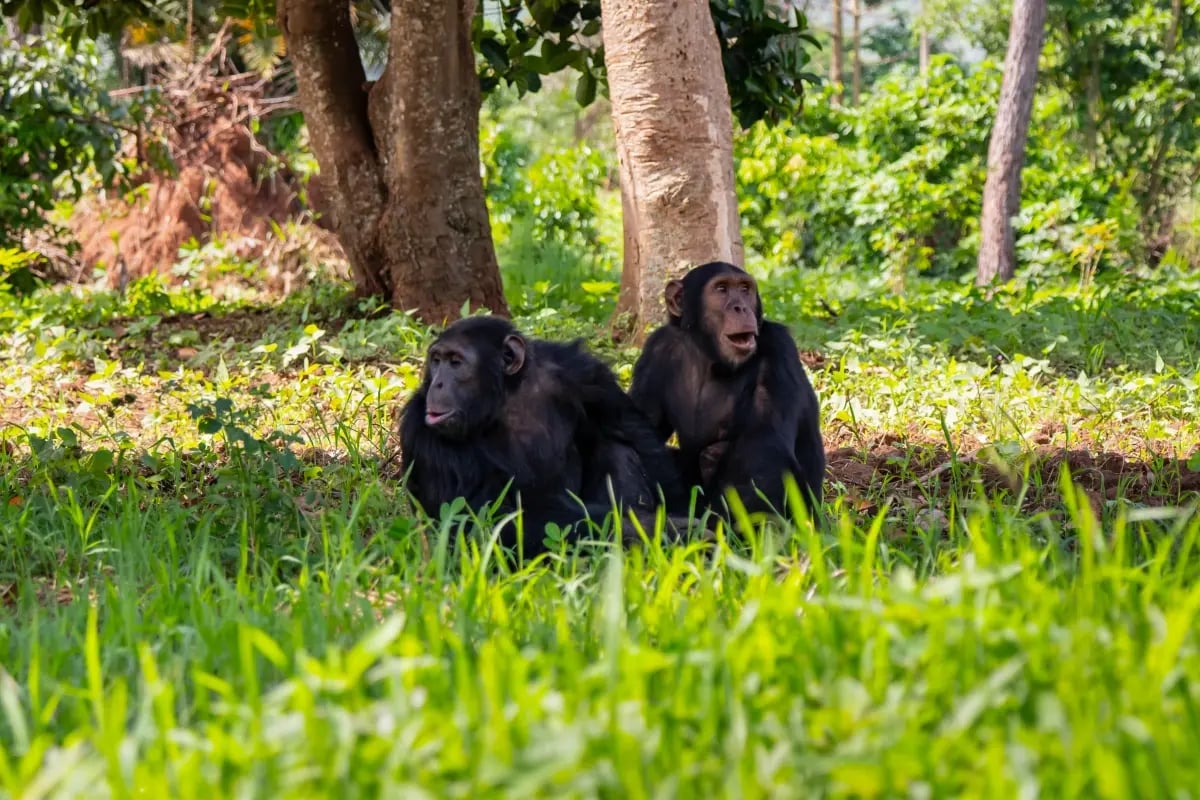 Bulindi chimpanzees in their natural habitat in Uganda. Bulindi Agroforestry and Chimpanzee Conservation Project, Green Earth.
Bulindi sits in the Hoima district, in a corridor of small tropical forest fragments between two large reserves, Budongo and Bugoma. Over 300 wild chimpanzees survive in these shrinking forest fragments on agricultural land, in a corridor that links chimpanzee populations of more than 500 individuals. Since the 1990s, the corridor forests have been extensively logged and converted to farmland.
Read more: How to choose high-quality carbon credits
The project plants millions of indigenous and fruit trees in those fragments and the corridors between them, supports local households with sustainable income through agroforestry so that they do not need to clear more forest, and restores the habitat the chimpanzees use to move between reserves.
Two things are worth noting about the project structure, in light of the science above. Restoration is not happening on empty plantation land; it is happening inside an existing, degraded tropical forest, which gives the regrowing trees the soil biology, fungal networks, and seed sources to recover faster. And the chimpanzees the project protects are themselves seed dispersers, while the Green Earth team members do the carbon work, in the precise sense the PNAS study described. The carbon sequestration outcome is matched by the biodiversity and social co-benefits the project generates.
Every verified carbon credit the Bulindi project issues represents a tonne of CO₂ removed from the atmosphere and a piece of corridor forest that exists because of the project.
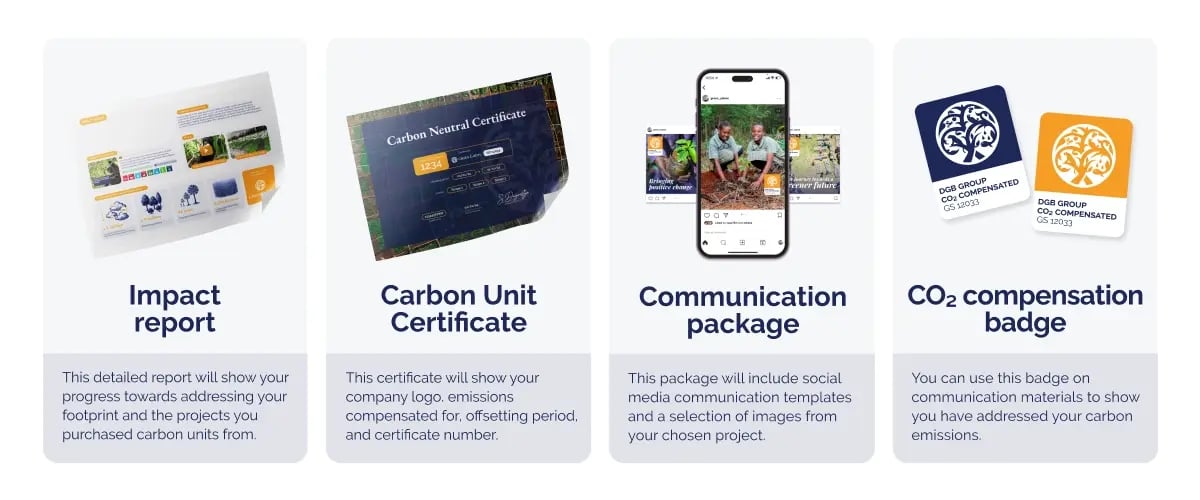 Materials you receive when you compensate for your footprint with Green Earth, showing your impact translated into measurable restoration.
When you buy high-quality carbon credits from our broad range of nature-based projects, you get a personalised Impact Report showing the project your purchased credits from and the number of hectares restored and trees planted because of your investment. This Impact Report is what makes your carbon footprint and action taken through offsets tangible. It translates your numbers into measurable positive outputs, which you can share and celebrate with stakeholders.
That is what Green Earth means by engineering possibilities. We help you measure your business’ footprint accurately. Guide you on what can be reduced at the source. And provide high-integrity carbon credits to compensate for residual emissions through verified nature-based projects with real-world benefits.